Monitor network traffic with ntop
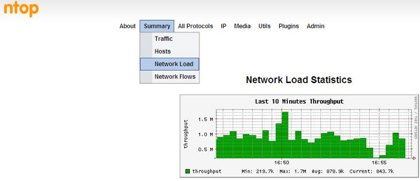
How do you monitor your network traffic? Of course using MRTG, you might say. Yes, that’s true, MRTG does an excellent job of monitoring traffic across networks and devices (router/switches). But when you see an abnormal traffic in MRTG, how do you find out what is generating that extra abnormal traffic? This is where ntop comes into play. Basically, MRTG shows you a bigger picture, whereas ntop lets you zoom into individual networks and hosts, and gives you enough information to pinpoint the hosts or devices generating extra/abnormal traffic.
ntop is a tool that shows network traffic usage. It is based on libpcap and when installed in a place where it can capture network traffic (hub or a mirrored port of a switch), it logs and reports information concerning IP and Fibre Channel traffic generated by each host in the network. ntop has a very rich and user-friendly web interface for reporting.
This is what ntop can do for you:
* Sort network traffic according to many protocols
* Show network traffic sorted according to various criteria
* Display traffic statistics
* Store on disk persistent traffic statistics in RRD format
* Identify the indentity (e.g. email address) of computer users
* Passively (i.e. withou sending probe packets) identify the host OS
* Show IP traffic distribution among the various protocols
* Analyse IP traffic and sort it according to the source/destination
* Display IP Traffic Subnet matrix (who’s talking to who?)
* Report IP protocol usage sorted by protocol type
* Act as a NetFlow/sFlow collector for flows generated by routers (e.g. Cisco and Juniper) or switches (e.g. Foundry Networks)
* Produce RMON-like network traffic statistics


 There are many things you can and should do to keep your system and network secure. As the saying goes — “Security is not a single event or a product, it’s a process”. So, you’ve to keep up with all the changes, installing firewalls, IDS/IPS, network security monitoring, auditing, making security policies, password policies, email policies and so on… Yes, all of them are very important and you’ll be dealing with most them depending on your security requirements. But there’re some basic things every network and system admin should follow. Personally, I’ve found 4 things that are very simple yet effective in securing your systems.

Recent Comments