Monitor network traffic with ntop
How do you monitor your network traffic? Of course using MRTG, you might say. Yes, that’s true, MRTG does an excellent job of monitoring traffic across networks and devices (router/switches). But when you see an abnormal traffic in MRTG, how do you find out what is generating that extra abnormal traffic? This is where ntop comes into play. Basically, MRTG shows you a bigger picture, whereas ntop lets you zoom into individual networks and hosts, and gives you enough information to pinpoint the hosts or devices generating extra/abnormal traffic.
ntop is a tool that shows network traffic usage. It is based on libpcap and when installed in a place where it can capture network traffic (hub or a mirrored port of a switch), it logs and reports information concerning IP and Fibre Channel traffic generated by each host in the network. ntop has a very rich and user-friendly web interface for reporting.
This is what ntop can do for you:
* Sort network traffic according to many protocols
* Show network traffic sorted according to various criteria
* Display traffic statistics
* Store on disk persistent traffic statistics in RRD format
* Identify the indentity (e.g. email address) of computer users
* Passively (i.e. withou sending probe packets) identify the host OS
* Show IP traffic distribution among the various protocols
* Analyse IP traffic and sort it according to the source/destination
* Display IP Traffic Subnet matrix (who’s talking to who?)
* Report IP protocol usage sorted by protocol type
* Act as a NetFlow/sFlow collector for flows generated by routers (e.g. Cisco and Juniper) or switches (e.g. Foundry Networks)
* Produce RMON-like network traffic statistics
Installation
ntop is available for Linux/Unix, Windows and Mac OSX. Windows demo version with limited packet capability is freely available for download. If you want to use the Windows version on production environment, you either need to compile it by yourself or buy a binary version with updates and support. But Linux/Unix and Mac versions are freely available, both source and binary.
Installation of ntop is pretty straight forward, here I’m going to demonstrate a binary rpm installation in CentOS 5.x. We’ll use RPMForge repository for ntop installation, so first we need to upgrade our rpm to rpmforge.
Download the rpm and upgrade it.
# rpm -Uhv rpmforge-release-0.3.6-1.el5.rf.i386.rpm
Install the dependencies
#yum install glib libpcap
Install ntop
# yum install ntop
Edit the config file /etc/ntop.conf, and comment out the setting to run in daemon mode
Change –daemon to # –daemon
Set to the network interface that you use for sniffing data
–interface eth1
Comment out the option for port 3001 for SSL
Change #–https-server 3001 to –https-server 3001
Run the ntop to set your password
# /usr/bin/ntop @/etc/ntop.conf -A
Edit the config file /etc/ntop.conf and set back to daemon mode
Change #–daemon to –daemon
Use chkconfig to make the service start on every reboot
# chkconfig ntop on
Start the service.
# service ntop start
That’s it, now you can use your web browser to access the ntop web interface. It has a lot of user-friendly reporting and admin options. Here’re few screenshots from the web interface of ntop.
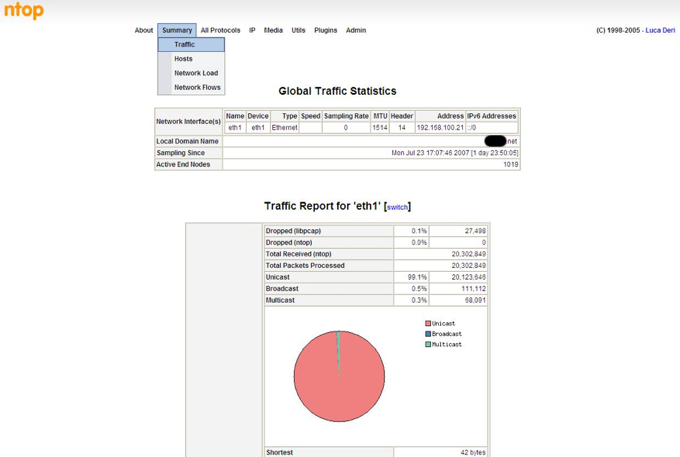
Browse https://ip_address:3001 and you’ll see the Global Traffic Statics
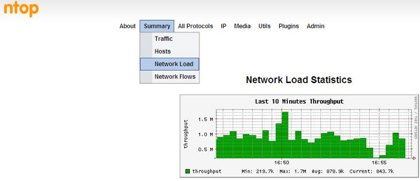
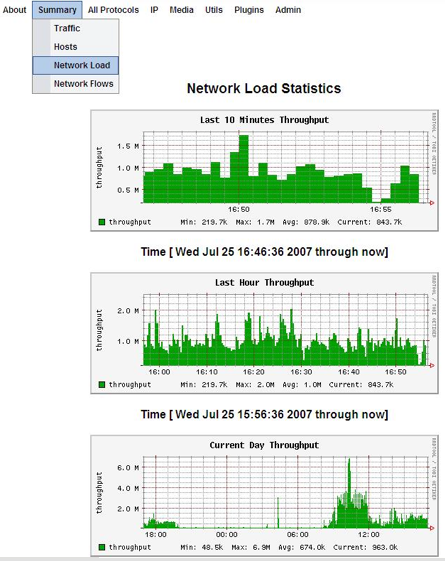
Network Load Statics displays the network traffic history: last 10 minutes, last hour, current day and last month.
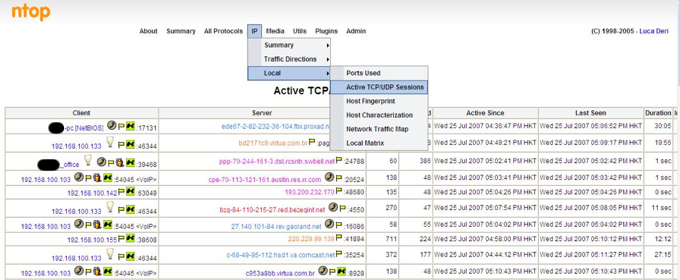
Active TCP/UDP session shows which client in the network is connected to which server, the information includes source/destination ip address/port numbers and duration of the connection.
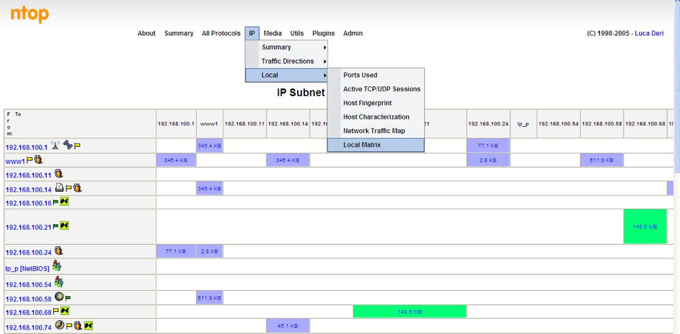
Local Matrix, shows the amount of data exchanged between hosts in the local subnet.
Network Traffic All Protocols/All Hosts displays the amount of data sent/received by each local and remote hosts. After reviewing the data usage we can zoom in to the individual hosts for more detail.

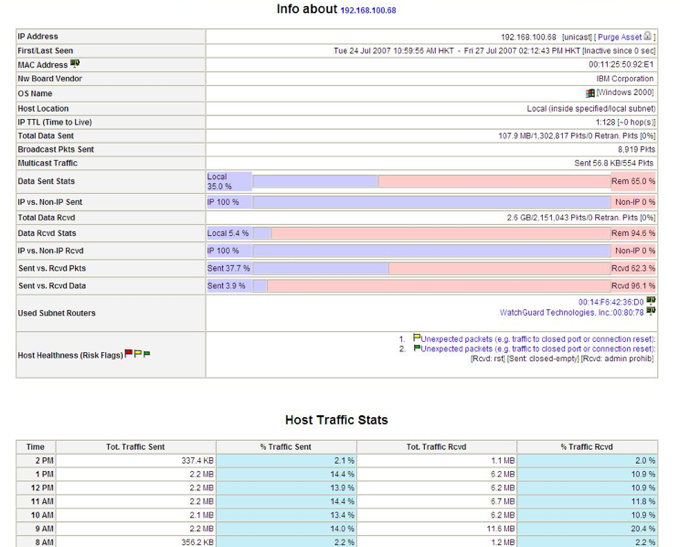
The details of a single host, includes almost every detail you would like to know about this host.


When I choose IP->Local->Local Matrix,I get a message: “No Data To Display (yet)”.I am able to use most of the features, but this.Is there something I need to enable to obtain either the IP subnet matrix or the dump of the host matrix? Can you help me to solve this problem?
Thanks in advance…
Hi Niranjan Kunwar,
Thank you for your guidance about the ntop,now I understand it more . I have a problem about the Local Matrix(IP->Local->Local Matrix),the information in my computer is “IP Subnet Traffic Matrix
No Data To Display (yet)”.What should I do next?
Regards
hi everyone
i hope someone could help me with this one
i want to create an mrtg.cfg file for some routers but i want only to create graphs for certain interfaces such as bridge (br0) and ethernet(eth0)
how do i do that?
i tryed somany –ifref-descr and –ifdesc-desc,name,nr arguments in this command :
cfgmaker –global “WorkDIr=…” –global “Options[_]: growright,bits” router@(i.e. 10.0.0.3) > test1.cfg
but I always get all interfaces, maybe there is a way to not show the out commented interfaces?
im looking forward to this problem, and hope someone could get me an hint
thx